Summary
A+ Colorado’s signature Outliers report is a compendia of which districts are beating the odds in terms of student outcomes, and which districts are behind the curve across many different metrics. It provides the state of the State for education, and identifies noteworthy districts that are supporting excellent outcomes for students. Given the COVID-19 pandemic disruption in our schools, it is more important than ever that educators and policy makers know where schools have been successful for different student populations.
This year’s Outliers 2020: Colorado School Districts Beating the Odds offers readers a myriad of ways to explore the wealth of information the Colorado Department of Education collects and provides information about how students are faring in school districts across the state.
Here you can explore demographic trends, see which are the bright spots in achievement across the state, and assess where we are going next as a state with our preparation of students for life beyond high school.
You can read the full print version of the report here or continue below to dig into the dashboards to see how your district compares, where different groups of students are excelling, and find your own data stories worth sharing.
Why We Care
This chart helps to answer how student outcomes in a school district compare to outcomes students see in similar school districts. As an organization we aspire to create and support an education system where student demographics do not correlate to student performance inside the classroom. Yet current research and experience documents a relationship between what happens outside of the classroom, and how students perform in the classroom. Here we look at how districts with similar student populations support those students to meet grade-level expectations in core academic subjects.
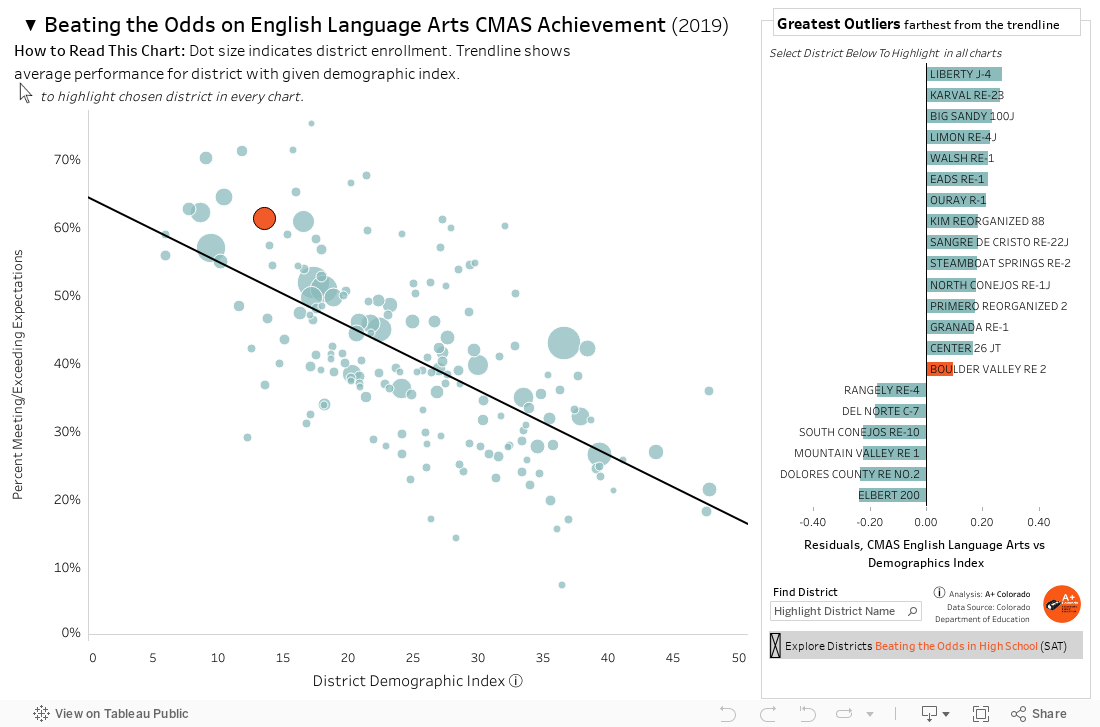
How To Read This Chart
Each dot represents a district. The size of the dot corresponds to the number of students in that district. The demographic index represents the portion of students in the district that are receiving special education services, qualifying for free or reduced price lunch, inter-district student mobility, and emerging multilingual students. The higher the number, the greater number of students in these categories are in the district. The height of the dot shows the percent of students meeting or exceeding expectations in that given subject.
The black trend line shows the average share of students meeting or exceeding expectations for a district with that demographic index. If dots are above the line it shows that those districts are performing better than the average district with similar demographics. If a dot is below the line it shows that those districts are performing worse than the average district with similar demographics.
Explore more information about:


1. The Colorado Department of Education should continue to facilitate and expand opportunities for districts to convene with and learn from similar districts. In this report we highlight places where other districts might be able to turn to and find opportunities to learn from and with districts facing similar challenges. We believe the Colorado Department of Education is uniquely positioned to play a role as convener where districts that are similar can engage in dialogue to see how educators across the state are addressing the challenges they face. This would undoubtedly lead to unique learnings for the State as well. We hope that learnings from these convenings can be captured for practitioners, policymakers, and communities across the state.
2. The state and districts should be clear on what barriers to educational opportunities exist in their communities, and work to eliminate them. This report focused on identifying students experiencing homelessness in order to draw attention to the support that these students may need that are different from other students in stable housing. Understanding who our schools and districts serve is critical to ensuring that they are providing all students an equitable and excellent education. We strongly support continued focus on understanding student demographics, communities, and ensuring that the education system recognizes and supports our students’ backgrounds and experiences.
3. Colorado must direct investments in math education to rapidly increase achievement in mathematics. Over the past decade the state has made concerted efforts to build literacy in our elementary schools, knowing that this foundational tool allows students to become life-long learners. We believe that continuing to work towards increasing literacy rates is critical. However, stagnant math scores and an uncertain future of work underscore the need to invest in math education with an emphasis on raising outcomes for students across income, race and ethnicity to remove any existing achievement gaps.
4. No Silos! Our data on postsecondary pathways cannot be limited to college enrollment. Colorado needs to connect data, and needs to collect information on students pursuing pathways or going directly into the workforce. Our understanding of what is working and what isn’t would be significantly bolstered if K-12 education data were linked to data on postsecondary outcomes beyond college enrollment. The Department of Education should ensure that it fosters a culture of learning that allows for these types of projects when they arise. However, it is also incumbent on other state departments to share relevant data so that we can better understand which pathways are being used by students, and which pathways can be improved upon.
5. Improved data collection, both categorically and qualitatively. The stories we see here show one part of the picture. The limited answers we can provide is directly related to the limited data that is publicly reported. Quality data will allow us to ensure that all students, and as many different experiences as possible, are counted. We strongly urge the Colorado Department of Education to continue to interrogate the ways that they can report data that is unsuppressed, and disaggregated. This transparency issue is foundational so that we, as a state, are able to hold districts accountable and see which districts are beating the odds.
Data & Methodology
Data sources:
Data are accessed through the Colorado Department of Education and the Colorado Department of Higher Education. All data are publicly available, except for the underlying data used to calculate A+’s unique District Demographic Index. To ensure we could accurately calculate the District Demographic Index, the Colorado Department of Education provided unsuppressed aggregate district-level rates of student eligibility for free or reduced priced lunch, students who are emerging multilingual, students receiving special education services, and student mobility.
Calculations:
Across measures, these dashboards prioritize district-level data; state rates are calculated based on the reported district-level data, and exclude data that is suppressed at that level.
The District Demographic Index provides a lens to understand districts that are serving similar demographics of students. The Index combines demographic and community factors that are often correlated to student academic performance on standardized assessments. The most recent year of data available at the time of calculation was used. The index is calculated as:
District Demographic Index = [(40% * SY 2018-19 District FRPL Eligible Rate) + (20% * SY 18-19 District Emerging Multilingual Rate) + (20% * SY 18-19 District SPED Rate) + (20% SY 2017-18 Inter-district Student Mobility Rate)] * 100
Data Suppression:
All data included in Outliers 2020 are subject to the current reporting and suppression rules used by the Colorado Department of Education, which vary based on the data set. Most datasets are subject to sample-size suppression of small cohorts of students including some demographic data. Many datasets are also subject to cell-size suppression that is applied, regardless of the size of the cohort. Datasets about aggregate academic performance are subject to both sample-size and cell-size suppression, as well as complementary suppression, whereby additional cells of data are suppressed when a cohort or cell does not meet the reporting threshold to avoid backwards mapping to the cell value.
A+ deeply believes student privacy and safety should not be compromised through public data reporting. We also believe that the current suppression rules go well beyond the requirements to appropriately protect individual student data, and in fact compromise the public’s ability to understand how the education system serves students. For more information, see www.righttoknowco.org/report-cards/.
Resources
- Download Print Report
- Download Press Release
- Interested in learning more about a specific district? Contact us.
- Previous Outliers Reports: 2018, 2017