
What you’ll find on the High School + Beyond Page
- District-level high school student achievement on the PSAT and SAT in Evidence-Based Reading and Writing, and Math for different groups of students
- College-going rates and rates of students enrolled in college who do not need to take remedial coursework
Why We Care
Though students may choose from many paths after high school, we believe deeply that any student who wishes should have the capacity to enroll in an institution of higher education without needing to pay for skills they should have attained in high school. Indeed college is an important pathway that should be available to all students, as research from the Center on Education and the Workforce shows that access to “good jobs” — those paying at least $35,000 per year, at least $45,000 for workers age 45 and older, and $65,000 in median earnings– increases with additional levels of education (albeit inequitably across race).
These charts explore measures of college-readiness, including SAT scores for different students across districts, matriculation rates, and rates of students who do not need remedial coursework when they do attend a postsecondary program. Remedial coursework not only decreases the likelihood that students will finish school, but it raises the cost of school, exacerbating the equity gaps that already exist in our education system.
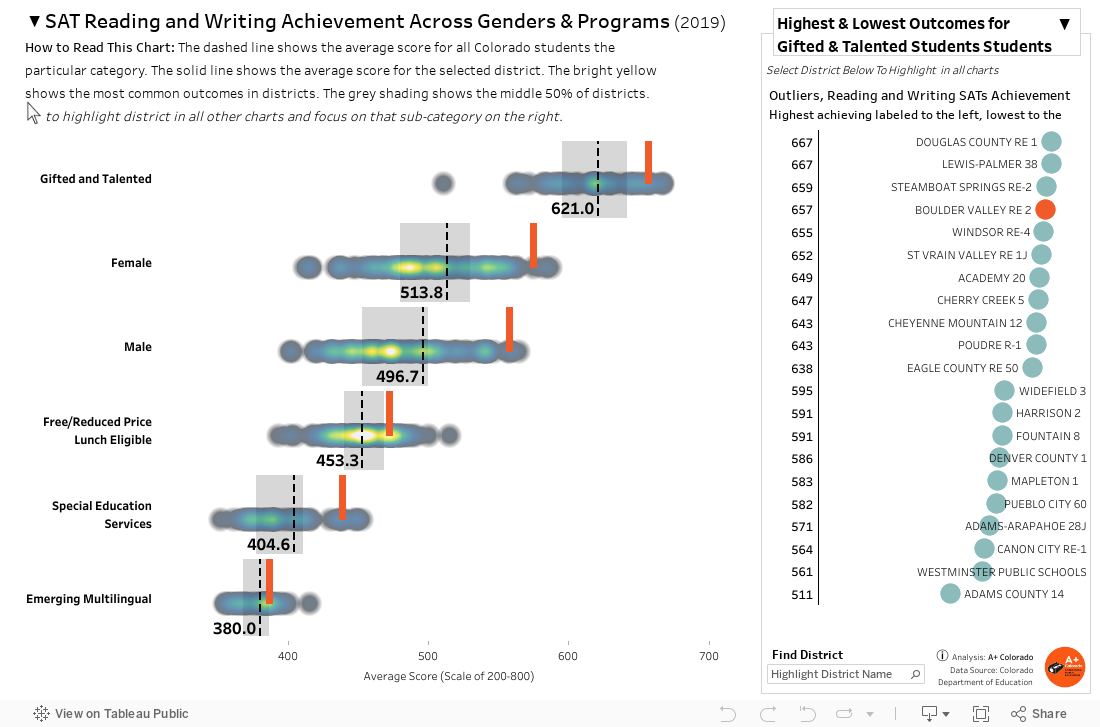
How to Read This Chart
The main chart shows average SAT scores in districts across the state. Each fuzzy dot represents the average score in one district; the dots get brighter when there are more school districts with that average score. The dashed line shows the average score for the specified group of students across the state. The solid grey line shows the average score in the selected school district.
Use the drop down in the title to switch between the average score in Evidence-based Reading and Writing and in Math, and to switch between results for students by race and ethnicity, and by gender and instructional programs.
The right side chart shows the highest and lowest average scores in districts for a selected group of students. Use the dropdown in the top right to switch between student groups in this chart.
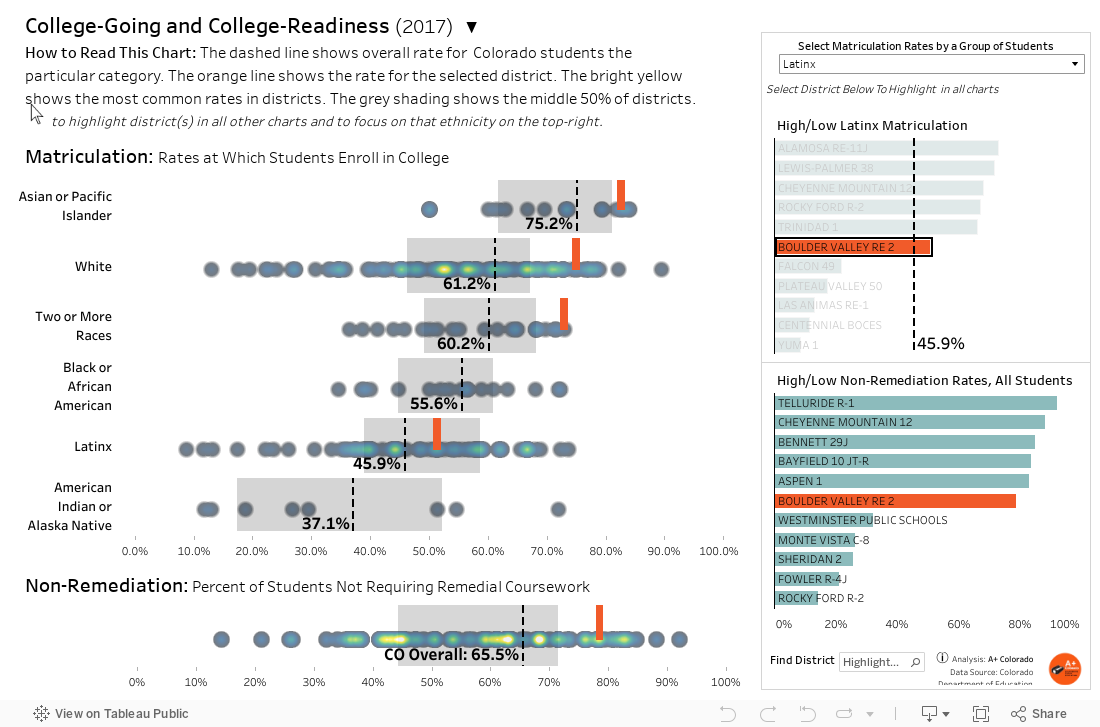
How to Read This Chart
The main chart shows the rate at which students of different racial and ethnic backgrounds in districts matriculate (enroll) in a postsecondary program after graduation, and the percent of all of those students who did not need to take remedial coursework when they did enroll. Use the drop down in the title to switch between matriculation and non-remediation rates for the class of 2012 and the class of 2017 (the most recent year of data). A fuzzy dot indicates the average rate for a school district; brighter dots show matriculation and non-remediation rates for more school districts. The dashed line shows the overall matriculation and non-remediation rate for the particular group of students across the state, and the solid grey line shows the rate for the selected district. The grey shading shows the rate for the middle 50% of districts, which helps viewers understand the range of matriculation and non-remediation rates across the state.
The chart on the top right shows the districts with the highest and lowest matriculation rates for the group of students selected in the top drop down. The chart on the bottom right shows the districts with the highest and lowest non-remediation rates for all students.
Explore more information about: