
What you’ll find on the Elementary and Middle School Page
- District and school-level student achievement in English Language Arts and Math in grades 3-8
- Average student growth in school districts in grades 3-8, and in high school with a focus on different student groups
Why We Care
Colorado lays out its expectations for what students should know and be able to do at the end of each grade in the Colorado Academic Standards. Annually, the Colorado Measures of Academic Success (CMAS) assessment sheds light on how school systems are supporting students to master these standards in Language Arts and Math.
Over the past decade Colorado has, rightly, emphasized reading as a key area of focus. Over the past four years we have seen the average share of students meeting expectations in reading, writing, and critical thinking, measured by CMAS, shift up. The distributional shift upwards means that most of Colorado’s districts saw significant improvements in the share of their students meeting standards over this period of time. The same cannot be said for math, where the whole of the distribution remained largely the same from 2016 to 2019, and outcomes remain lower than in English Language Arts.
In this dashboard, you can dig into academic outcomes for elementary and middle school students in core academic subjects.
While it is appropriate and helpful to understand whether students are meeting grade level expectations, it is equally important to understand how students are making progress. Growth sheds a light on whether students learned more than their peers across a single year, regardless of whether they came in well ahead or well behind the grade level expectations. This dashboard explores how much students learned in the past year relative to other students across the state with similar academic backgrounds.
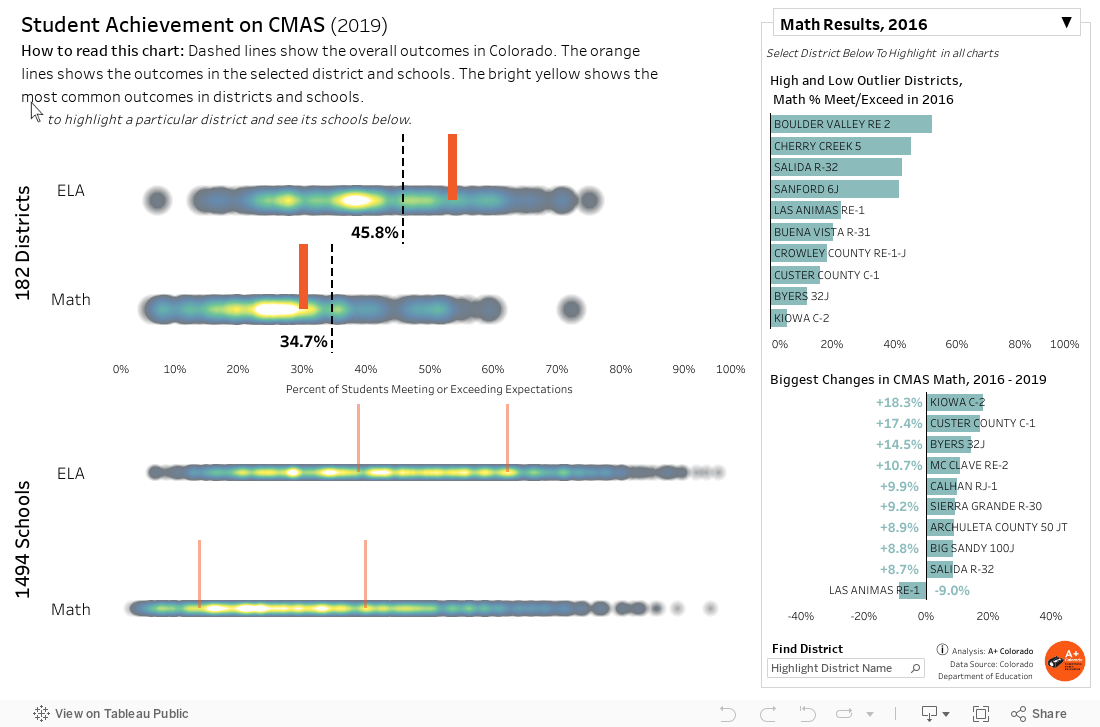
How to Read This Chart
The middle charts show the range of student outcomes in districts (top) and schools (bottom) across the state in English Language Arts (ELA) and Math. A greater percentage of students in districts and schools on the right side of the chart met or exceeded grade level expectations than those in districts or schools toward the left side of the chart. Selecting a school district in the top charts will also highlight the schools within the district in the bottom chart.
The right side charts explore the districts with the highest proportions of students meeting or exceeding expectations in the selected academic subject, as well as districts that saw the biggest changes in the rate of students meeting or exceeding expectations. Use the dropdown to switch between subjects and years. You can also highlight a particular district in all of the charts by using the search bar on the bottom right.
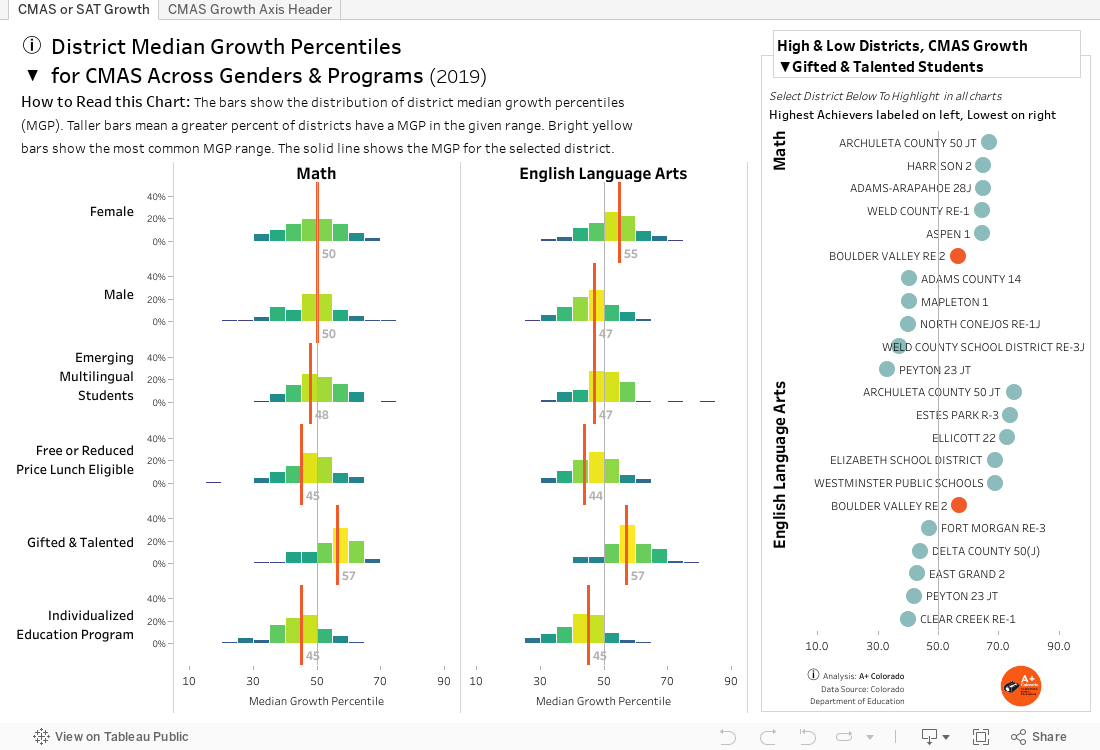
How to Read This Chart
Use the drop down in the title to select your focus in the main chart on growth in either CMAS for students in grade 3-8 and PSAT/SAT for students in grades 9-11. Within these education levels you can focus on student groups by race and ethnicity, grade, or gender and instructional services.
The main chart shows the percentages of districts with specific ranges of median growth percentiles for different groups of students. A larger bar shows more districts saw a median growth percentile (MGP) in that range; a lighter green or yellow bar shows the most common range of growth for that group of students. Hover over the bar for a list of districts in that MGP range.
The right side charts show the districts with the highest and lowest growth for the student group selected at the top drop down.
Explore more information about: