Recognizing Our Gaps
Denver’s release of its School Performance Framework begs many questions about school quality in Denver and how to expand academic opportunity across the city. The SPF serves a great number of purposes to a great number of people. But there are a few things it is not.
First, the SPF is not a holistic view of a school. It says nothing about the school design, pedagogy, or instructional model. It does not say anything about academic programming, electives, or extracurricular offerings in schools. It does not say anything about facilities, funding, partnerships, or resources.
Second, the SPF is rarely the sole reason why any decision is made, by anyone interacting with the school system. For example, when families chose schools, the SPF may certainly play a role in the decision about which school to attend, but so too may proximity, program, and culture amongst others. For administrators, the SPF may guide some investments and support but it is not the only determinant.
What the SPF does do however, is provide a synthesis of a great number of data points to get a general sense of the academic gains and achievement of students in the last two years. Does this capture all learning that happens within a school in a given year? Absolutely not (indeed, academic measures in subjects outside of math and language arts are deplorably absent). Does the SPF capture some important information about how much students are learning and whether they are on track to master critical academic content? Absolutely.
With that in mind, it bears a deep dive into how Denver schools are serving students.
Restoring Confidence and Signaling The Work To Be Done
Last year’s SPF had some challenges. Most critical was the inclusion of early literacy data results that were not aligned to language arts expectations in later grades. Additionally, there was legitimate concern that the bar for a quality school was not reflective of the massive improvements needed in many schools to ensure most students were meeting grade level expectations (this was not a new critique: see correspondence between a coalition of groups including A+ and DPS about this issue in 2014).
This year, DPS, true to its word, raised the academic quality bar by a) raising expectations for measures of academic proficiency; b) reducing the weight of and realigning early literacy results with state standards; and c) broadening business rules around academic gaps where schools cannot earn a blue or green rating if students of color, emerging multilingual students, students eligible for free or reduced price lunch, or students with disabilities face significantly disparate outcomes relative to their other peers in the school.
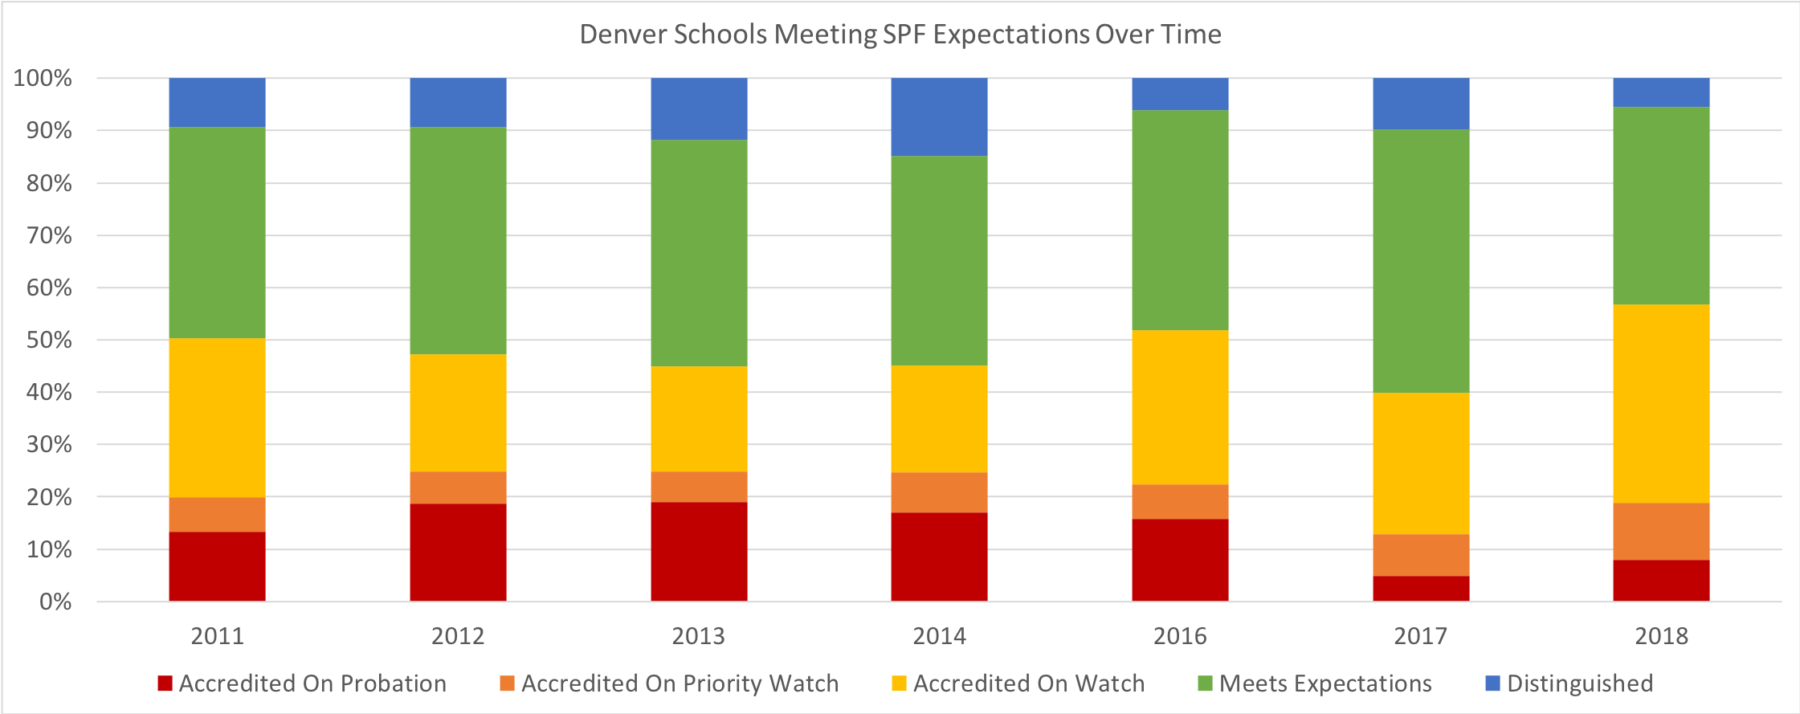
This year 43% of Denver’s 201 schools received a rating of Green (Meets Expectations) or Blue (Distinguished). 38% of schools were rated Yellow (Accredited on Watch). 11% of schools were Orange (Accredited on Priority Watch), and 8% were rated Red (Accredited on Probation). Fewer schools (and a lower proportion of schools) received a Green or Blue rating in 2018 than have since the SPF’s debut in 2018. Other than last year when there were clear issues with the rating system, a lower proportion of schools earned Orange or Red than ever before.
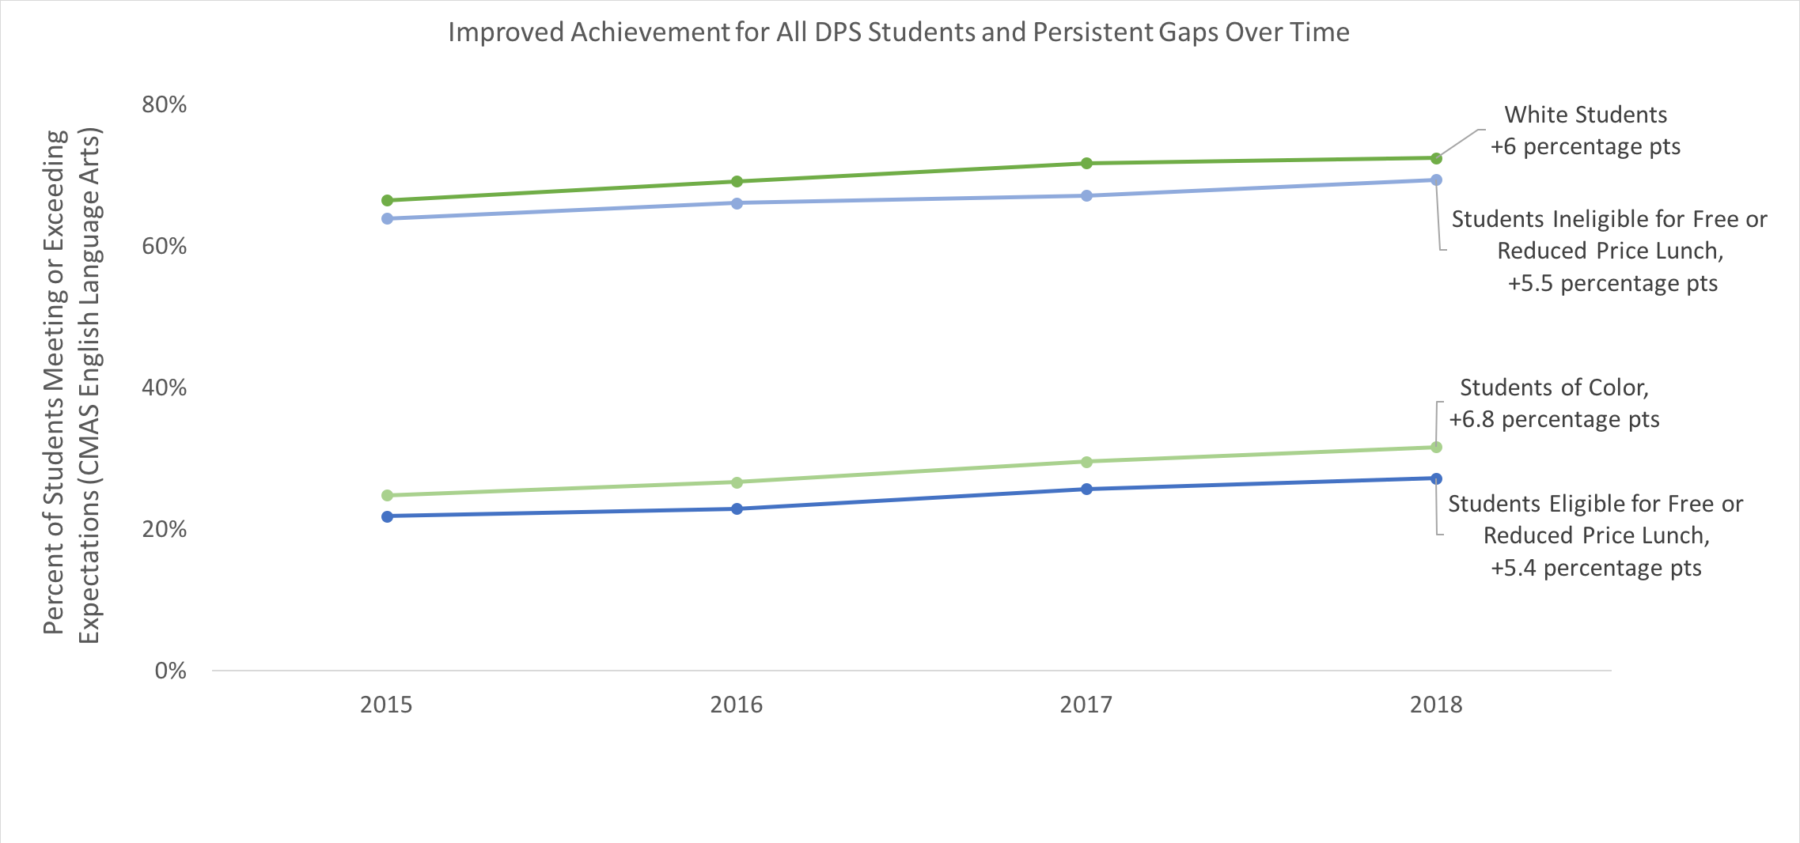
Raising the academic bar is critical; DPS is still far from ensuring an equitable excellent education. Indeed, in a district where there are yawning disparities in performance for students of different racial, socioeconomic, or linguistic backgrounds, it is imperative that the district ensure systems reflect the work to be done to support all students in the district. More students are meeting academic expectations in the district, yet in 2018 only 27% of DPS students who qualified for free or reduced price lunch met or exceeded grade level expectations in English Language Arts, and 32% of DPS students of color did so.
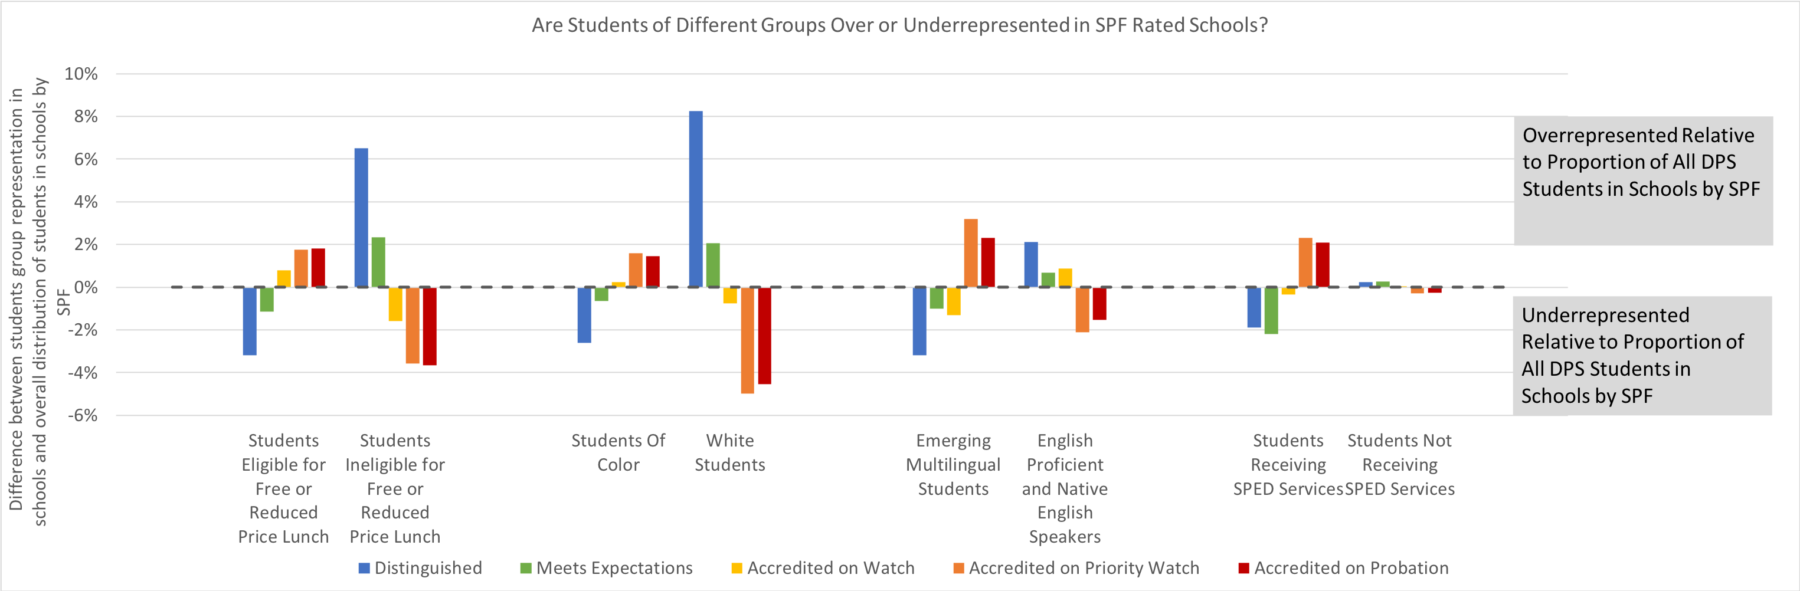
Mirroring to some extent the disparities in academic outcomes for students, there are clear inequities in terms of who sits in blue and green schools across the city.
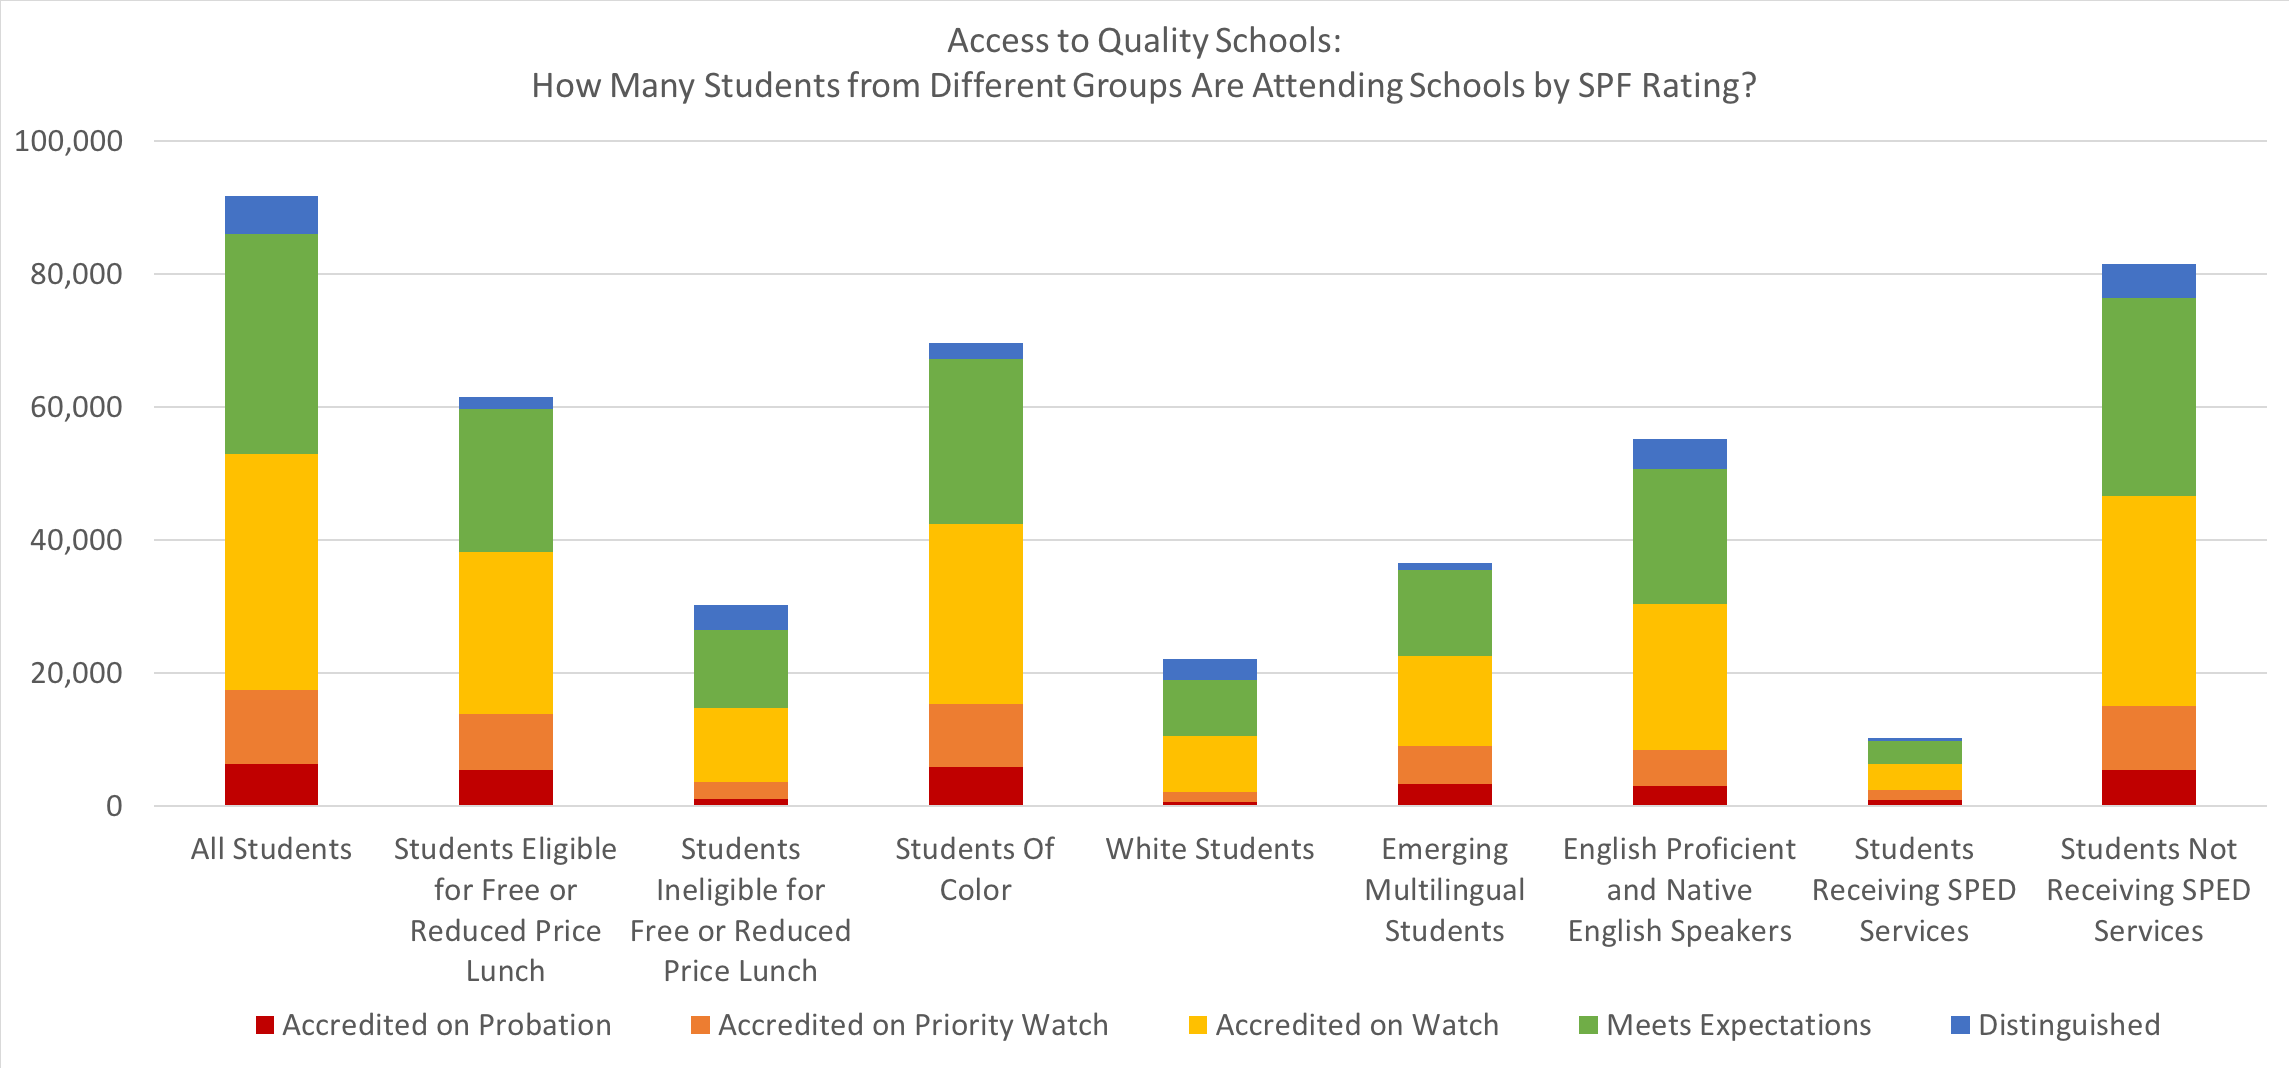
Indeed, even though 43% of schools were rated Blue or Green, the likelihood that students eligible for free or reduced price lunch were in Blue schools in particular was far less than for their affluent peers. Same for students of color and emerging multilingual students compared to their white and English proficient peers. Students in special education were far less likely to find themselves in Blue or Green schools.
Holding Schools Accountable for Disparate Academic Outcomes For Students
Two years ago DPS put a line in the sand: if outcomes were so different between groups of students within school buildings then schools could not be rated green or blue on the DPS SPF. This came to be known as the “Academic Gaps” indicator.
This year 20 schools that earned sufficient points overall to be Green had their rating lowered to Yellow because they did not meet expectations on the Academic Gaps indicator. 23 schools earned the lowest score of “does not meet” on the Academic Gaps indicator. This should be a red flag for schools, and an opportunity to dig into how they need to tailor supports for different students; it is also an opportunity for the district to understand and scale strategies from schools that are best supporting students eligible for free or reduced price lunch, students of color, emerging multilingual students, or students in special education.
The Academic Gaps indicator seems to be under fire from some, including some Board members as evidenced at the Board work session on Monday October 15th. And while I concede there are some challenges with the Academic Gaps measures, unlike some who seem ready to throw out the measure all together, I see a way forward. In fact, I believe deeply that a focus on how schools are serving students eligible for free or reduced price lunch, students of color, emerging multilingual students, and/or students in special education is the most important part of an accountability system, and that the current measure is a step in that direction.
My critique on the other hand has to do with measurement and incentives. First: measurement. The Academic Gaps indicator is an index of measures of “focus groups” within schools (students eligible for free or reduced price lunch, students of color, emerging multilingual students, or students in special education). For a host of measures, the district first looks at whether students of a “focus group” met the benchmarks the district sets for the measure in question. Second, and here is where I have some concerns, the district looks at any gap between the “focus group” and the other students in the school not in the focus group. I contend that, while within-school gaps are concerning, even more worrisome are the gaps across the district and should be incorporated in the measure. This is especially true since schools are increasingly segregated by socio-economic status and race.
This leads directly into my second concern around perverse incentives. I worry that, without a backstop from the district, the “high stakes” nature of the Academic Gaps indicator may disincentivize schools from enrolling diverse student populations. After all, if your school doesn’t enroll low-income students, you can’t be held accountable for how you serve low-income students. We’ve made the argument that the district set goals around integration, ensuring that background or zip code does not preclude students from accessing schools, and clearly there might need to be work done around how the district encourages equitable enrollment while supporting schools to be successful in educating all students that come through their doors well.
Addressing High Schools
Only 18% of DPS high schoolers are in schools rated Green or Blue this year. That is significantly fewer than their counterparts attending Green or Blue elementary or middle schools. So what is going on?
The high school framework is by far the most complicated, including around 80 measures across two years (in comparison, the elementary framework includes around 60, and the middle school framework includes around 35). This is because the high school framework includes information around graduation, course access, and forecasted remediation rates that the earlier frameworks do not. Because of this complexity it is difficult to nail down exactly why schools receive one rating or another without digging into each measure at each school.
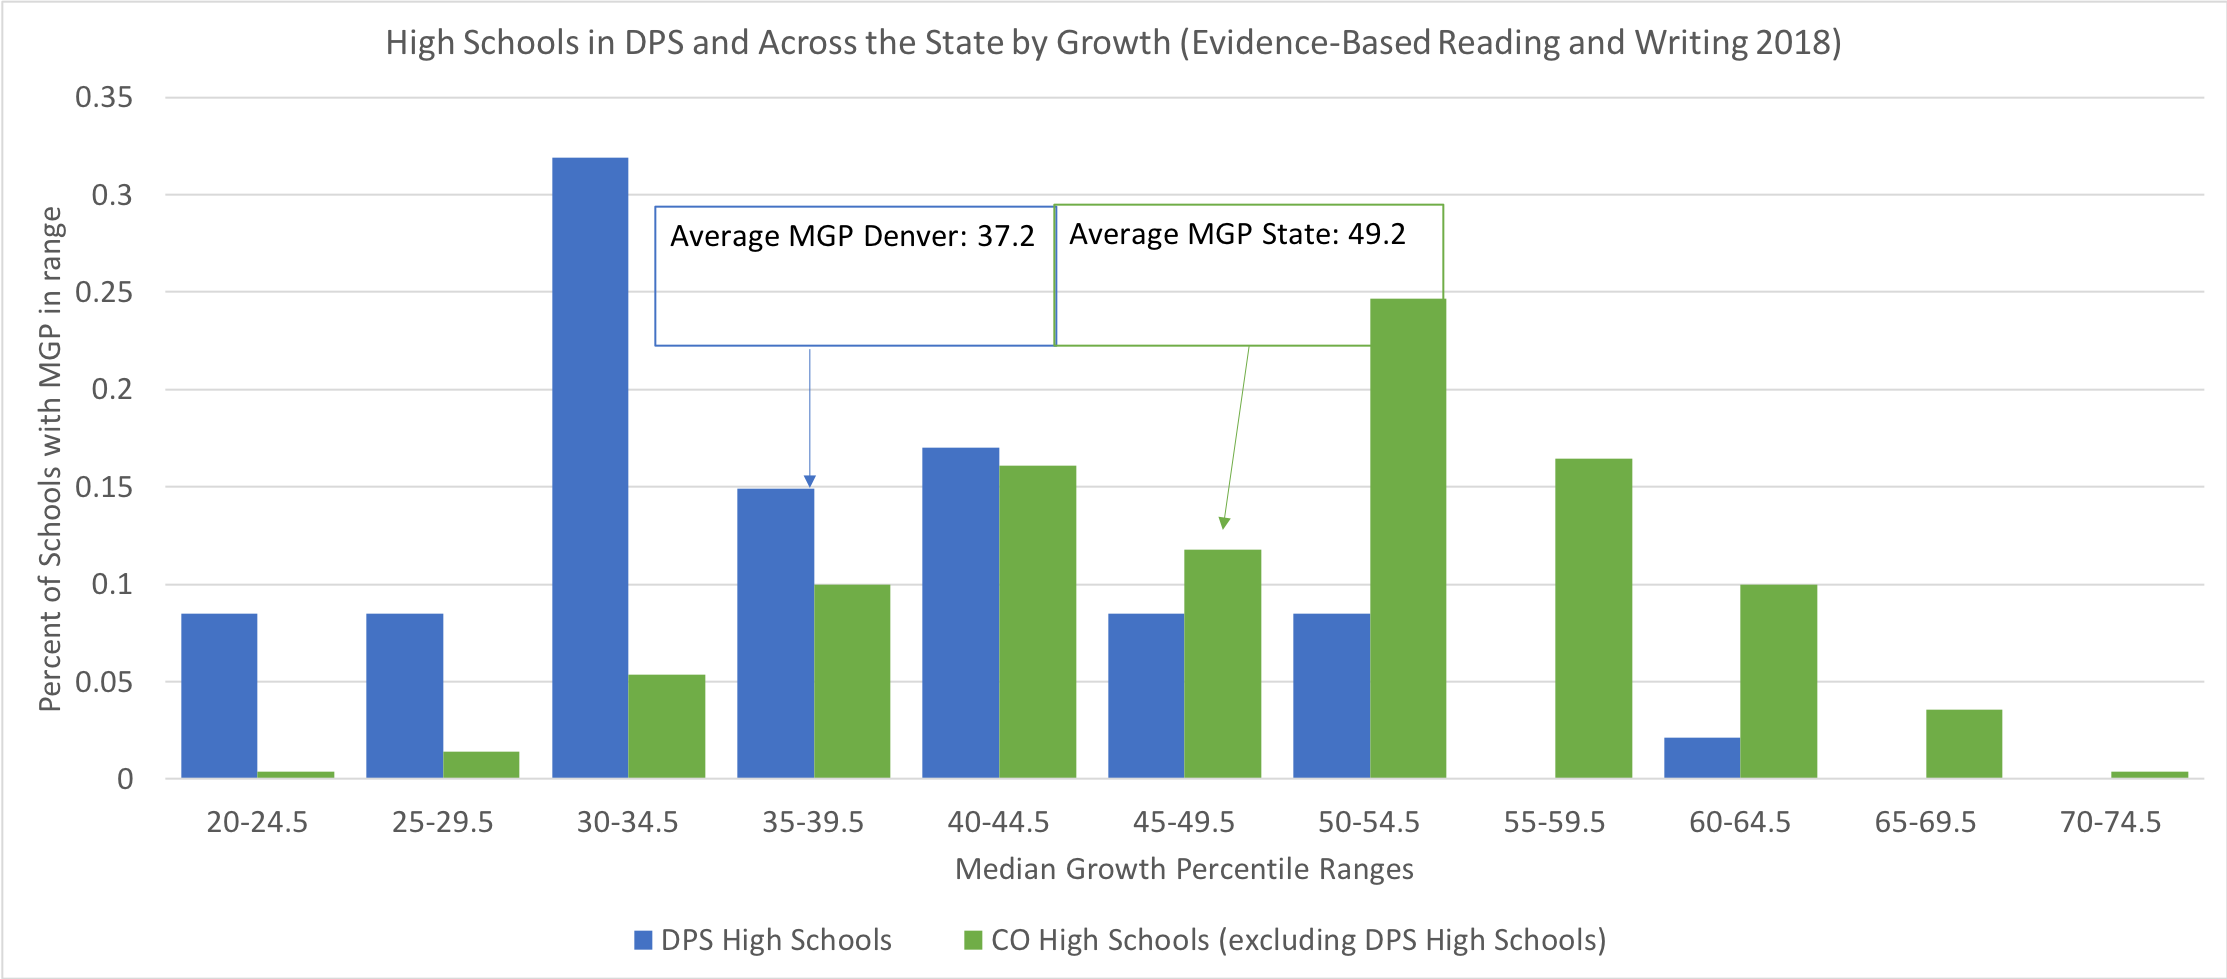
 That said, in some of the underlying data it is clear that there is a problem in terms of how schools supported students last year. Specifically the growth that high schoolers made in DPS last year was remarkably low. Yes, there was a new slate of assessments (PSAT 9, PSAT 10, and SAT), but this was true for students across the state and should not necessarily affect growth scores. DPS’ high school results should raise questions. For example, as shown below, the average DPS high school’s median growth percentile in Evidence-Based Reading and Writing was 37. Compare that with the rest of the state where the average high school’s MGP was 49. Low growth in DPS high schools wasn’t an isolated incident, and the SPF distribution reflects it.
Charters in Trouble?
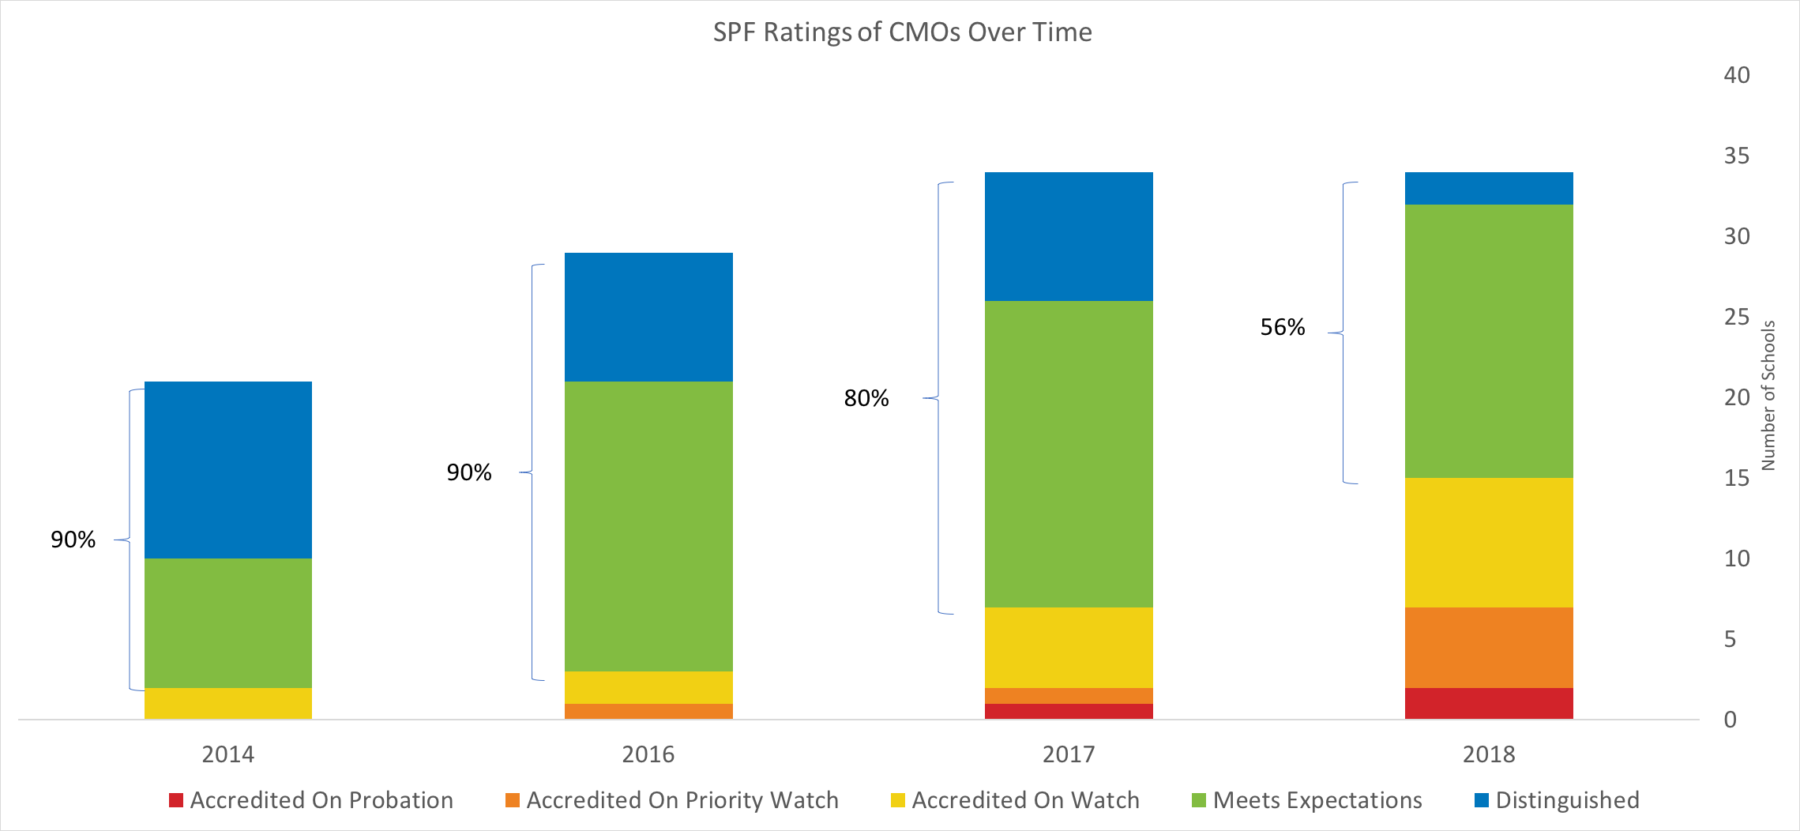
Some Charter Management Organizations (CMOs) have been replicating quickly in Denver over the past few years, a move predicated on their remarkably high performance and the district’s desire to rapidly add additional high quality seats. However, as CMOs have expanded, so too has variability in their academic performance. Indeed only 56% of CMO schools earned a green or blue rating on the 2018 SPF (compared to 23% of single-site charters and 43% of district-run schools, including innovation schools).
These results may beg the question around what is an appropriate pace of expansion for CMOs? Is there a limit to the scale of CMOs such that they can guarantee with more certainty the continuation of strong academic results? And more immediately, how will CMO operators address low performance within their schools? And how will the district hold them to account through their contract/renewal process or otherwise?
Lessons Learned and Moving Forward
As schools and communities take a look at the SPF and the data upon which their ratings are predicated, I hope there are some shared takeaways. A few that come up for me:
- We are far from where we need to be as a city in terms of ensuring an excellent education to every child. As a community we have a responsibility to set high expectations for ourselves if we are to build the education system that each child deserves.
- Understanding and communicating academic performance is a key responsibility of the district and of schools. There are some years where schools help the vast majority of their students reach new academic heights, and there are years where schools struggle to fulfill that promise. What is most important is that schools and communities use that information, regardless of the summative rating they earn, and ask: what worked well? What didn’t? And what changes need to be made?
- Academic outcomes for students are critical, but are not the whole story. The SPF does attempt to make sense of many academic measures. The SPF does not tell the whole story of a school, and the district and schools must get much better at measuring and communicating things beyond what the SPF captures. I very much doubt that is possible within an academic performance framework. But there are other aspects of schools and learning that are equally as important and not at all disconnected from the academic outcomes we expect for students. Aspects like course access, teachers, facility quality, and school culture.
- The process of defining expectations of schools must be an ongoing conversation between communities (most importantly students and families), schools, and administrators. As the Board hires a new superintendent and heads into a broad community engagement process, it is important to open channels of dialogue and co-create the systems that hold schools and the district accountable for serving students.